2026 Grantmaker Salary and Benefits Report: Key Findings

The 2026 Grantmaker Salary and Benefits (GSB) Key Findings is a visual highlight of the trends and changes that are shaping the philanthropic sector.

Also available as a free PDF, the 2026 GSB Key Findings is just a small fraction of the expansive dataset available in the 2026 GSB Report, which reflects information from 1,052 grantmakers for 13,362 full-time staff members. The full 2026 GSB Report will be available in early October.

Salary increase rates continue return to pre-pandemic norms

Median salary increases were a consistent 3% to 4% from 2009 to 2021, but in 2022 and 2023 the increase rate jumped to 5% amid the spike in inflation. Since then, the median increase rate has been slowly moving downward to 4.3% in 2024, 4.6% in 2025, and finally 4% in 2026. While this is higher than projected median salary increases of around 3.5% for all sectors of the economy, it does align with broader trends of a return to pre-pandemic norms.

Median Salary Increases

Turnover rates drop to lowest levels in five years

After turnover jumped in 2023 amid the Great Resignation, mean rates and total number of organizations reporting departures dropped in 2024 before rising again in 2025. In 2026, the mean turnover rate was just below 10% and the percentage of grantmakers reporting staff departures fell to 49%, the lowest levels reported in at least five years.

Mean Turnover Rate

202620252024

Reported Staff Departures

49%

of responding grantmakers reported staff departures for 2026.

57% in 2025
53% in 2024
 

Staff and executive diversity remain unchanged

People of color account for:

34.2%

of full-time grantmaking staff in 2026.

34.7% in 2025
33.5% in 2024
 

18.7%

of foundation CEOs were people of color, compared to:

18.6% in 2025
17.1% in 2024
 

Women account for:

76.1%

of full-time grantmaking staff in 2026.

76.0% in 2023
75.8% in 2024

65.4%

of foundation CEOs identified as female, compared to:

63.8% in 2023
62.6% in 2024

The gender pay gap among CEOs remains and continues to fluctuate slightly

2026

The median salary for female CEOs was:

The median salary for male CEOs was:

*or about 86.1% of the median salary reported for male CEOs.

2025

The median salary for female CEOs was:

The median salary for male CEOs was:

*or about 88.0% of the median salary reported for male CEOs.

The trends of decreasing real-dollar salaries appears to be moderating

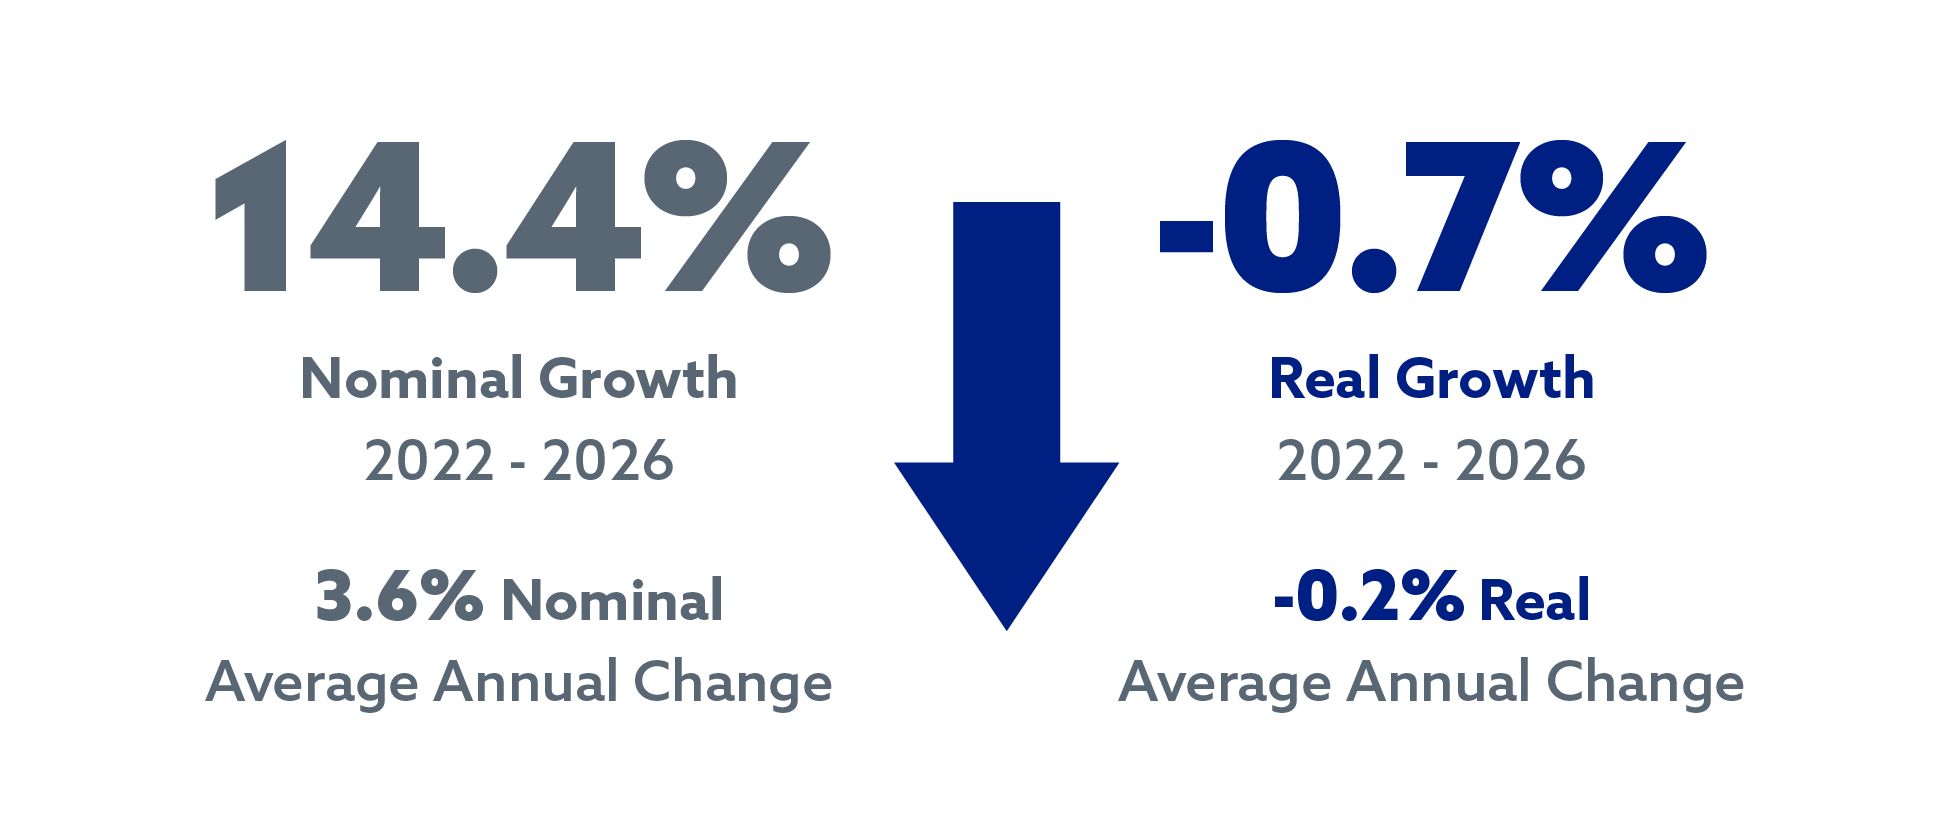
While non-CEO staff at community foundations continued to receive median salaries that were lower in real dollars than in 2022, the difference was much lower than in recent years, possibly due to inflation in the U.S. economy appearing to cool in late 2025 and early 2026.

All Community Foundation Staff Salary Growth

14.4% nominal growth leads to -0.7% real growth from 2022-2026

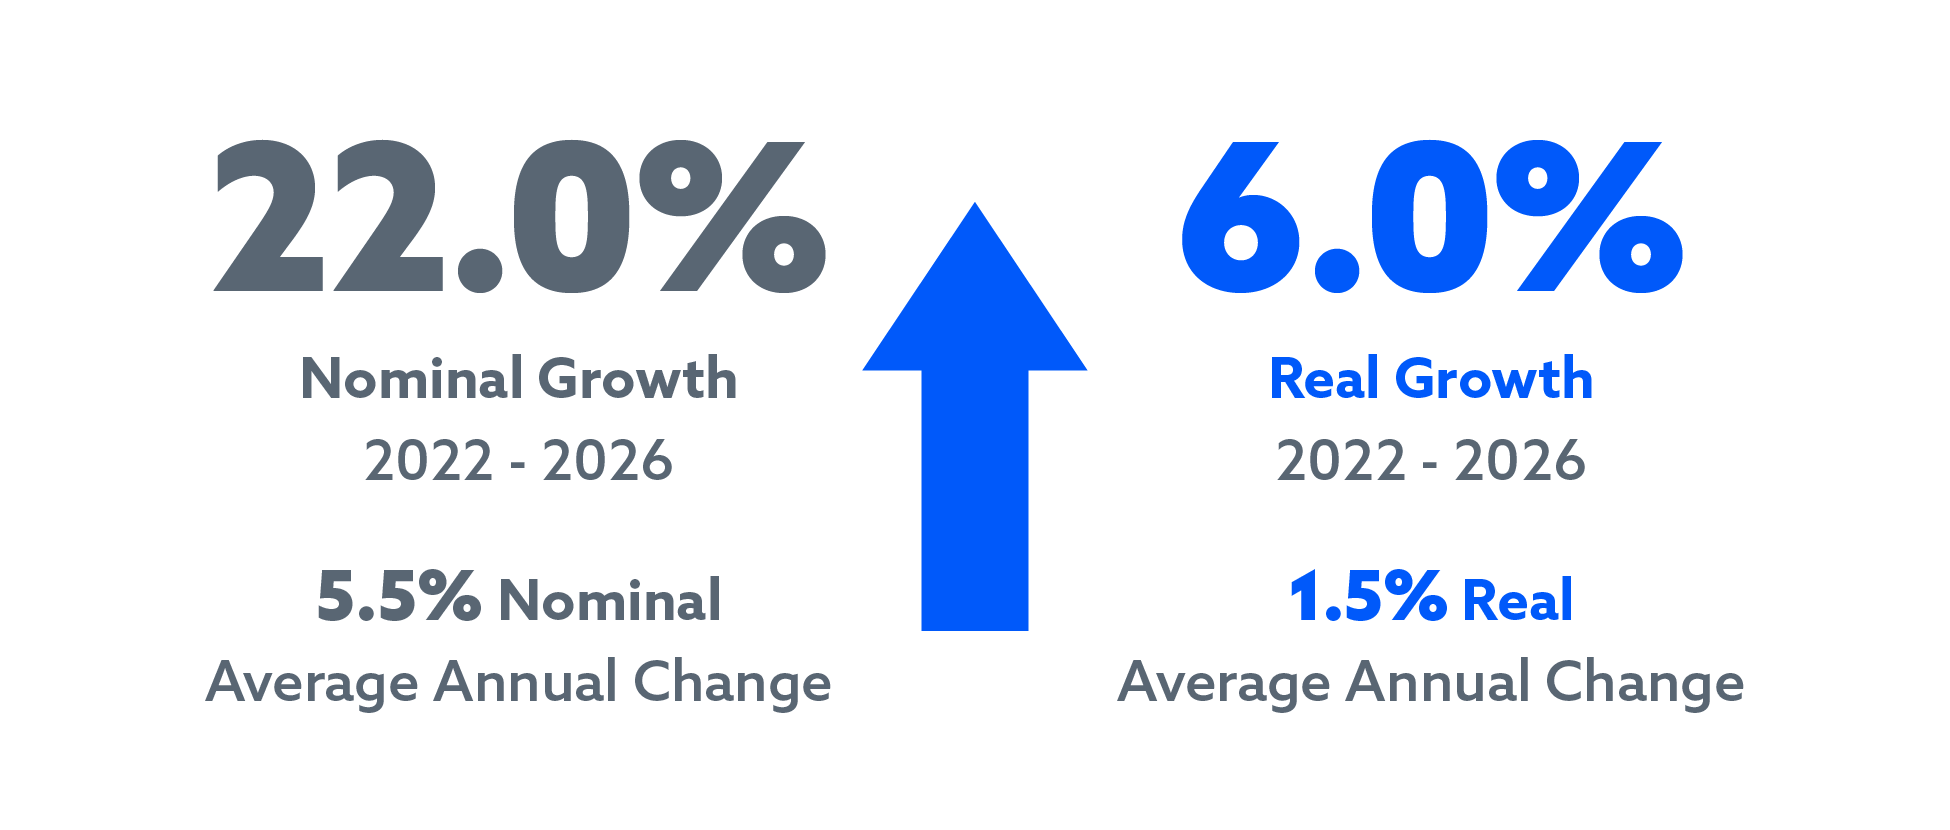
Community Foundation CEO Salary Growth

202% nominal growth leads to 6% real growth from 2022-2026

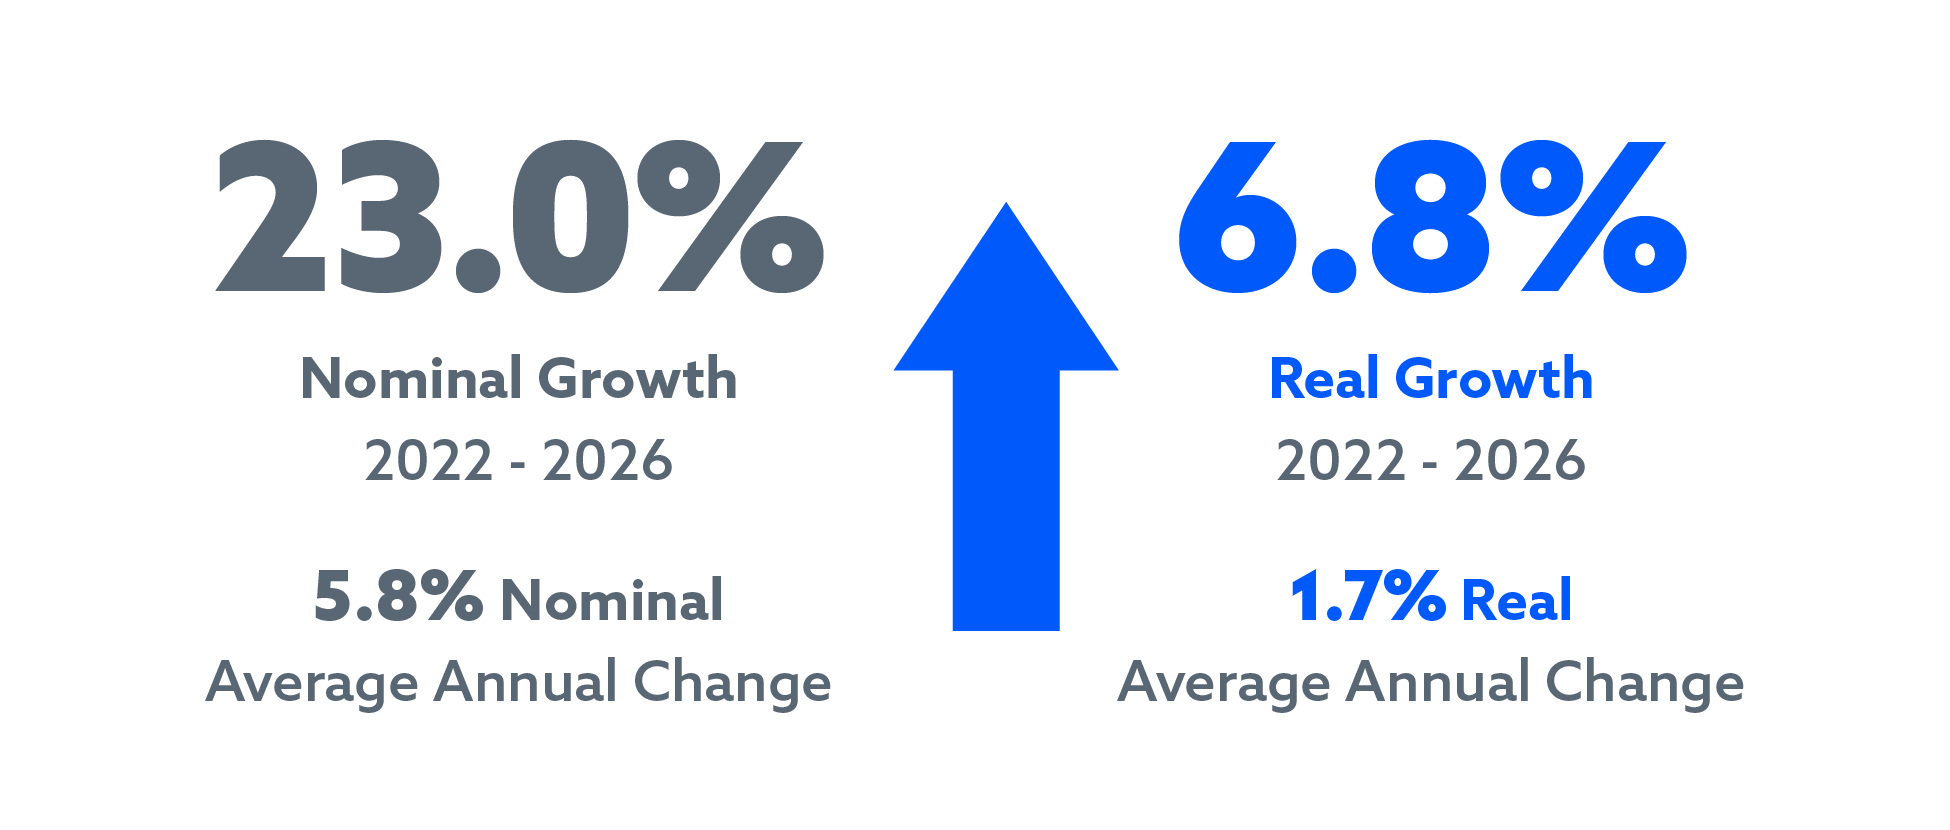
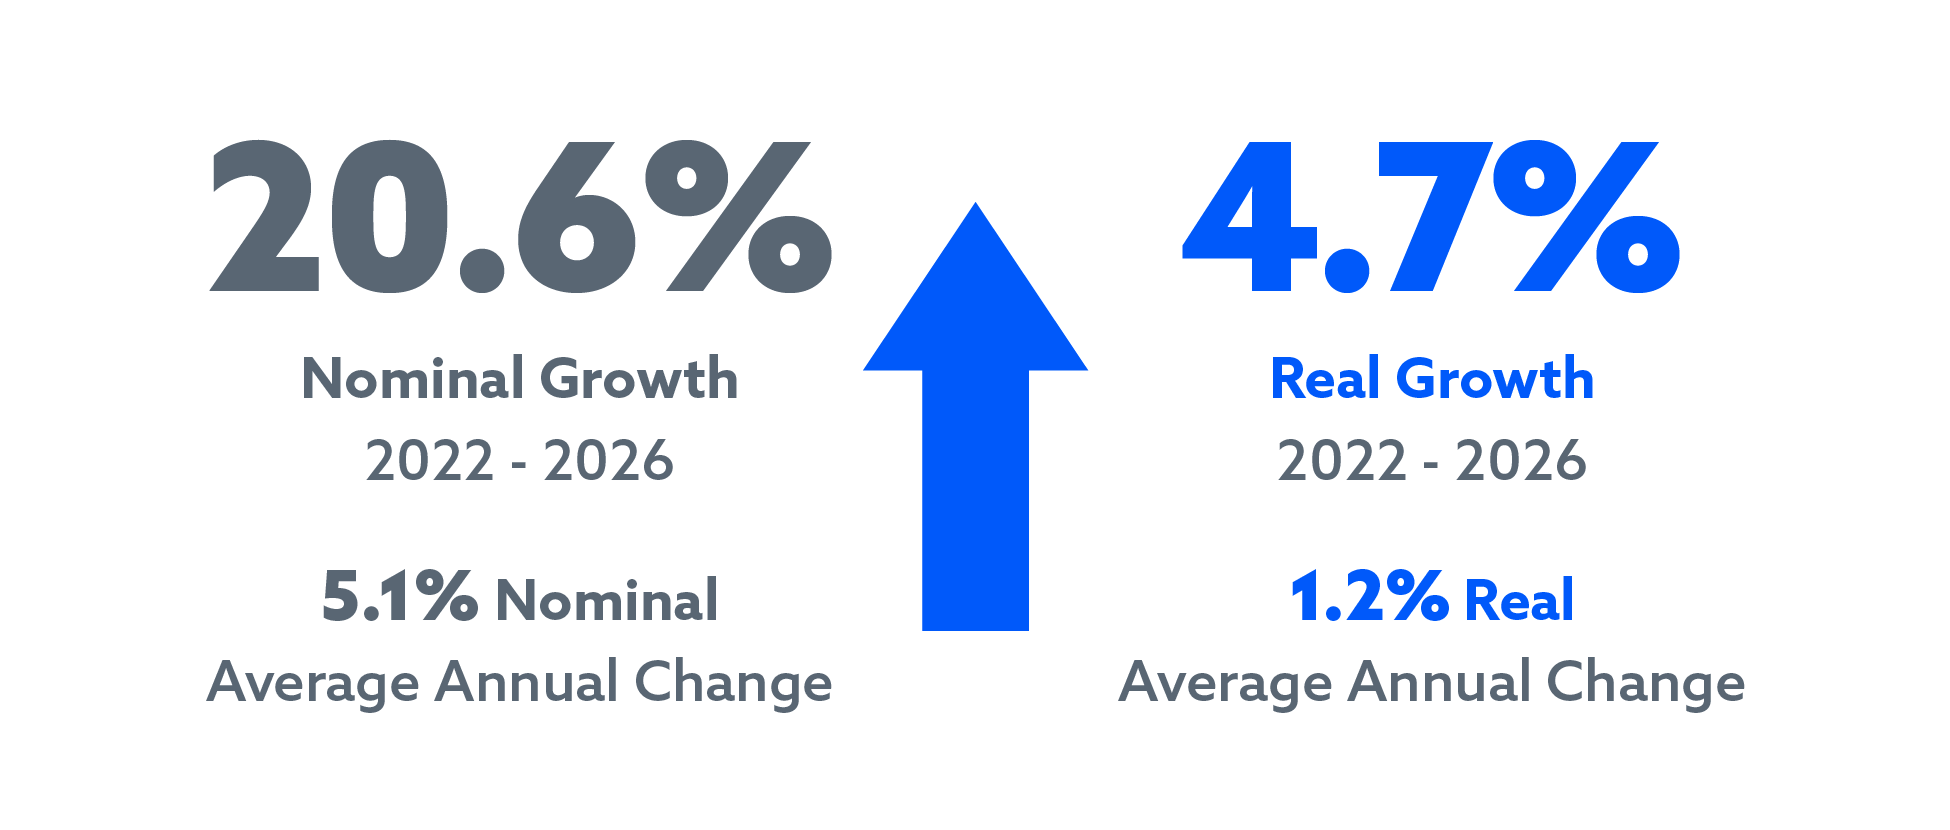
After several years in which inflation-adjusted salaries for private foundation CEOs were lower than salaries from five years prior, in 2026, real-dollar salaries for private foundation CEOs showed positive growth since 2022.

All Private Foundation Staff Salary Growth

23% nominal growth leads to 6.8% real growth from 2022-2026

Private Foundation CEO Salary Growth

20.6% nominal growth leads to 4.7% real growth from 2022-2026

Download the Report

Get Updates About the GSB

Email Sign UP

Get Updates

Sign up to get updates about the Grantmaker Salary and Benefits Report, and be the first to know when the 2026 Report is released.

Questions?

Connect with Council Staff
Share on FacebookShare on TwitterShare on LinkedInShare on all
Benchmarking
Human Resources & Operations