New Research: Foundations’ Spending in Support of Mission Holds Steady, Despite Second Year of Declining Investment Returns
The Council on Foundations-Commonfund Study Shows Private Foundation Investment Returns at Zero and Community Foundations’ Endowments Diminishing by -1.8 Percent
Data gathered in the 2015 Council on Foundations–Commonfund Study of Investment of Endowments for Private and Community Foundations® (CCSF) show that participating private foundations reported an average return of 0.0 percent for the 2015 fiscal year (January 1 – December 31, 2015), down from the 6.1 percent return reported for FY2014, while participating community foundations reported an average annual return of -1.8 percent compared with 4.8 percent for FY2014.
The effective spending rate remained unchanged at an average of 5.1 percent for all participating foundations.
“The message of this study is clear. Foundations are continuing to invest in their missions and maintain consistent spending. The question this study raises, however, is the long-term impact on endowment values if foundations do not experience more favorable investment returns in the near- and mid-term,” said the President and CEO of the Council on Foundations Vikki Spruill and Executive Director of Commonfund Institute William F. Jarvis in a joint statement. “Two years of low investment results have reduced foundations’ trailing 10-year returns to the 5.1-5.9 percent range. Without higher long-term returns, it will be difficult for foundations to maintain their endowments once annual spending, inflation, and investment management costs are taken into account. Foundations of both types have shown commitment to supporting their missions in a very tough investment environment.”
With 228 participating foundations representing combined assets of $100.6 billion, the Study is believed to be the most comprehensive annual survey of its kind. This is the fourth year that Commonfund and the Council on Foundations – two leading organizations in the field of foundation investment and governance policies and practices – partnered to produce this research.
SECOND YEAR OF LOWER INVESTMENT RETURNS
Lower Returns Across All Asset Classes
This was the second consecutive year in which foundations of both types realized lower investment returns: private foundations had reported an average return of 15.6 percent for FY2013, while community foundations had reported an average return of 15.2 percent for the same period. (All return data are reported net of fees.)
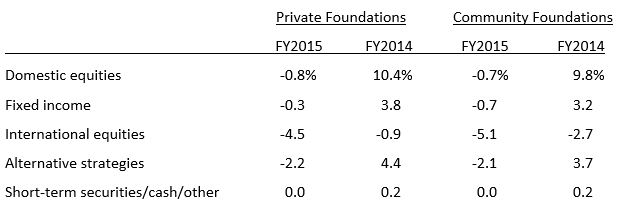
Returns for both foundation types were lower compared to last year among each of the five primary asset classes reported on by the Study. For the second consecutive year, international equities produced the lowest return, and returns on domestic equities swung sharply from positive into negative territory.
Investment Performance Varied by Foundation Type
When 2015 CCSF data are analyzed by size and type of participating foundation, private foundations produced the higher average annual return across all size categories. Among the largest foundations, private foundations generated an average return of 1.1 percent. Community foundations of the same size produced an average return of -1.5 percent. Among foundations with assets between $101 and $500 million, private foundations returned an average of -0.5 percent while similarly sized community foundations returned -1.9 percent. Among foundations with assets under $101 million, private foundations realized an average return of 0.1 percent while these community foundations matched the total return for the category, returning an average of -1.8 percent.
While private foundations’ returns were higher than those of community foundations over longer time periods, the gap between the two types of institution diminished as the time period
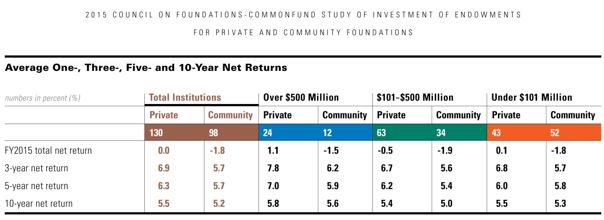
lengthened. For the trailing three-year period, private foundations returned an average of 6.9 percent, while community foundations’ average return was 5.7 percent. For the trailing five years, private foundation returns averaged 6.3 percent while those of community foundations again averaged 5.7 percent. For the trailing 10-year period, the spread narrowed to 30 basis points, with private foundations realizing an average return of 5.5 percent versus 5.2 percent for community foundations.
DESPITE POOR INVESTMENT RETURNS, FOUNDATIONS SPENT ON MISSION
Mission Spending
The effective spending rate remained unchanged at an average of 5.1 percent for all participating foundations. Spending in dollar terms rose this year. Across the three size cohorts, 50-51 percent of private foundations reported increased spending in dollars, while 50-65 percent of community foundations did so.
Foundation Fiduciaries Adapting to a Lower Return Environment
Foundation fiduciaries appear to be adapting to the potential for a lower return environment by moderating their long-term return expectations. Among private foundations with assets over $500 million, 16 percent had a long-term return objective of 9.0 percent or more in FY2014. For FY2015 that proportion fell to just 8 percent.
Among similarly sized community foundations, in FY2014, 36 percent targeted a long-term return in the 8.0-8.9 percent range. This year the comparable figure was 25 percent. Among smaller community foundations (those with assets under $101 million) the shift was greater, as 41 percent targeted a return in the 8.0-8.9 percent range in FY2014, but only 27 percent reported having that goal in FY2015.
DATA BY ASSET CLASS
Return Data
FY2015 return data for each of the major asset classes were zero or negative across the board. On a relative basis, the highest major asset class return—a flat 0.0 percent for both types of foundation—came from short-term securities/cash/other. After that, fixed income returned -0.3 percent for private foundations and -0.7 for community foundations. Domestic equities returned -0.8 percent for private foundations and -0.7 percent for community foundations. Alternative strategies resulted in a -2.2 percent return for private foundations and -2.1 percent for their community counterparts. As noted, the lowest return was generated by international equities, at -4.5 percent for private foundations, while community foundations reported a -5.1 percent return.
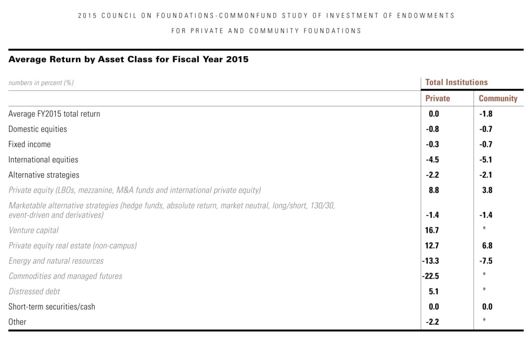
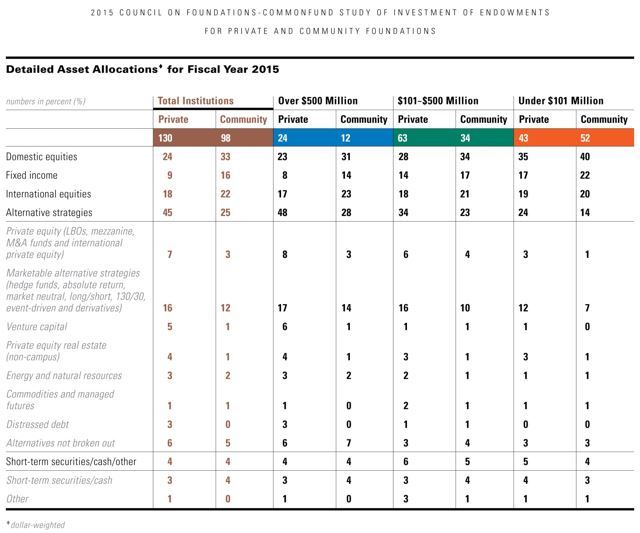
Within the broad category of alternative assets, the strongest return came from venture capital, which produced a 16.7 percent return for private foundations (the sample size for community foundations was too small for analysis). This was followed by a 12.7 percent return for private equity real estate (non-campus) for private foundations and 6.8 percent for community foundations. Private equity (comprising LBOs, mezzanine, M&A funds and international private equity) produced returns of 8.8 percent and 3.8 percent for private foundations and community foundations, respectively. The other positive return – in the distressed debt allocation – was 5.1 percent return for private foundations (the sample size for community foundations was too small for analysis). The sharpest decline, at -22.5 percent, came from private foundations’ allocation to commodities and managed futures (again, the sample size for community foundations was too small for analysis). Energy and natural resources returned -13.3 percent for private foundations and -7.5 percent for community foundations. Finally, marketable alternative strategies (hedge funds, absolute return, market neutral, long/short, 130/30, event-driven and derivatives) returned -1.4 percent for both private foundations and community foundations.
Asset Allocation
As of December 31, 2015, participating institutions’ asset allocations, and their comparable FY2014 allocations, were:
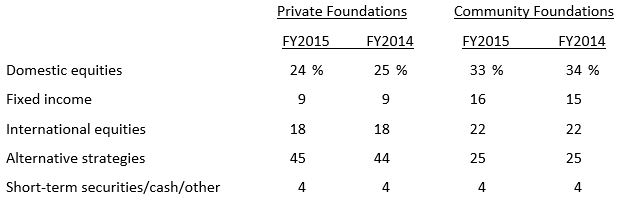
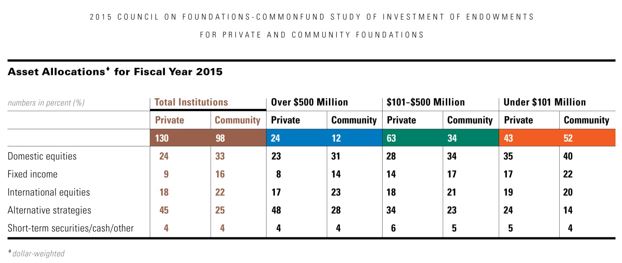
Asset allocations for both types of foundation remained remarkably stable from year to year, with virtually no change at the level of the major allocation categories.
RESEARCH PROCESS AND METHODOLOGY
NOTE: For purposes of this Report, we have included information and data for community foundation endowment funds only. The results of the research do not reflect the activity of the many different types of funds that community foundations hold that are non-endowed, such as non-endowed designated, field-of-interest, agency, scholarship and donor-advised funds, temporary project funds and pass-through funds.
The 2015 CCSF is the fourth annual report produced jointly by the Council on Foundations and Commonfund Institute. The Study segments participating private and community foundations by size into the following categories:
- Foundations with endowment assets over $500 million
- Those with endowment assets between $101 and $500 million
- Those with endowment assets under $101 million
The design of the 2015 Council on Foundations – Commonfund Study of Investment of Endowments for Private and Community Foundations (CCSF) took place in the winter of 2015.
Web-enabled questionnaires and field interviews with the participating institutions followed in the first and second calendar quarters of 2016.
Online survey responses were supported by extensive telephone contact, a research technique that assures greater integrity in the data gathering process. Respondents were the individuals most knowledgeable about investment matters at participating institutions.
Data from the Study’s research population were segmented by private foundations and community foundations to permit analysis of the policies and practices of these two differing foundation types. Data were also segmented into three size categories to compare and contrast the policies and practices of foundations of differing sizes as well as the investment results they produce, where applicable. As noted, the size categories were: institutions with assets over $500 million; institutions with assets between $101 and $500 million; and institutions with assets under $101 million.
The Study gathered data from 228 private and community foundations, with 130 private foundations and 98 community foundations participating.
The fourth annual CCSF will be made available to all participating foundations. The report will also include a comprehensive written analysis setting the data in the context of the 2015 financial environment and trends that shaped financial markets during the year.
About The Council on Foundations
An active philanthropic network, the Council on Foundations (www.cof.org), founded in 1949, is a nonprofit leadership association of grantmaking foundations and corporations. It provides the opportunity, leadership, and tools needed by philanthropic organizations to expand, enhance, and sustain their ability to advance the common good. With members from all foundation types and sizes, the Council empowers professionals in philanthropy to meet today’s toughest challenges and advances a culture of charitable giving in the U.S. and globally.
About Commonfund
Commonfund was founded in 1971 as an independent asset management firm focused on not-for-profit institutions. Today, we are one of North America’s leading investment firms, managing $25 billion in assets for some 1,300 institutional clients, including educational endowments, foundations and philanthropic organizations, hospitals and healthcare organizations and pension plans. Our only business is investment management, and we are active in all sectors of the global capital markets, both public and private.
About Commonfund Institute
Commonfund Institute houses the education and research activities of Commonfund and provides the entire community of long-term investors with investment information and professional development programs. Commonfund Institute is dedicated to the advancement of investment knowledge and the promotion of best practices in financial management. In addition to teaming with the Council on Foundations to produce the CCSF, Commonfund also produces the NACUBO-Commonfund Study of Endowments® (NCSE) and the Commonfund Benchmarks Study® series of research reports. Commonfund Institute also provides a wide variety of resources, including conferences, seminars and roundtables on topics such as endowments and treasury management; proprietary and third-party research and publications, including the Higher Education Price Index® (HEPI); and events such as the annual Commonfund Forum and the Endowment Institute®.